How to visualize vertical profiles from WRF in Matlab
Jump to navigation
Jump to search
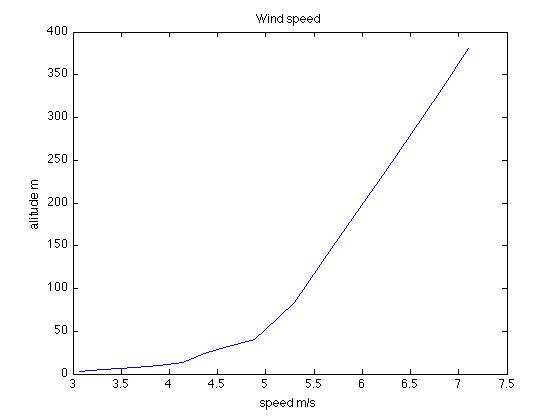
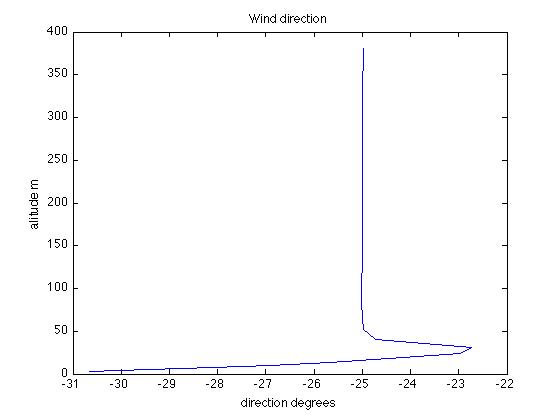
A vertical profile is a graph of an atmospheric variable, such as wind speed or temperature, as a function of height above the terrain, in a fixed horizontal location. Vertical profiles can be measured e.g. by tethered sondes or sensors on meteorological towers. Computation of a vertical profile from the state of an atmospheric model is useful for validation of simulations and as an observation function for data assimilation.
Prerequisites
Step by step direction
- cd wrf-fire/WRFV3/test/em_fire"" and start Matlab from the command line: matlab &
- Alternatively, change to the above directory from inside Matlab command window and run startup.
- In Matlab,
Examples
- vprofile('wrfout_d01_0001-01-01_00:01:00',100,100,1) will generate the profile at location 100m north and 100m west of the south-east corner of the domain from the specified wrfout file at history step 1
- vprofile('wrfinput_d01',100,100,[]) will generate the same profile from the WRF input file (this file is created by ideal.exe or real.exe).

