How to visualize vertical profiles from WRF in Matlab
Jump to navigation
Jump to search
- Back to the WRF-SFIRE user guide.
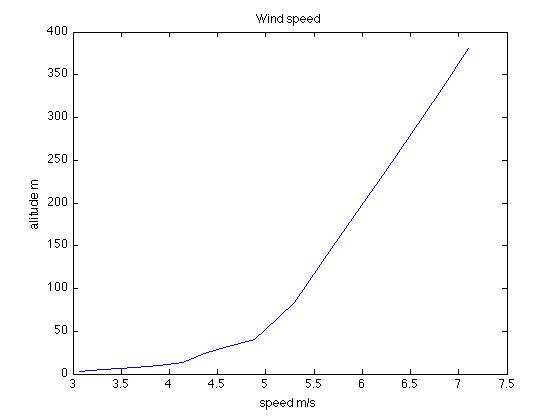
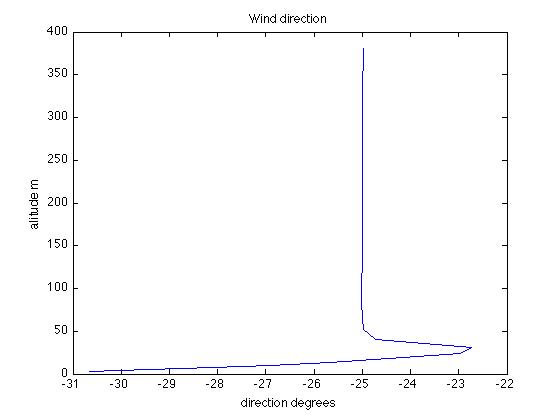
A vertical profile is a graph of an atmospheric variable, such as wind speed or temperature, as a function of height above the terrain, in a fixed horizontal location. Vertical profiles can be measured e.g. by soundings, sondes, or sensors on meteorological towers. Computation of a vertical profile from the state of an atmospheric model is useful for validation of simulations and as an observation function for data assimilation.
Prerequisites
Step by step direction
- cd wrf-fire/WRFV3/test/em_fire and start Matlab from the command line: matlab &
- Alternatively, change to the above directory from inside Matlab command window and run startup.
- In Matlab,
Examples
- vprofile('wrfout_d01_0001-01-01_00:01:00',100,100,1) will generate the profile at location 100m north and 100m west of the south-east corner of the domain from the specified wrfout file at history step 1
- vprofile('wrfinput_d01',100,100,[]) will generate the same profile from the WRF input file (this file is created by ideal.exe or real.exe).
- the vprofile script will also print to the terminal the information on the first few levels of the profile, such as
Wind profile at (300m 300m) from lower left corner of domain
Roughness height from LANDUSE 0.020m
layer altitude     U       V   speed  direction (degrees)
z0     0.020   0.000   0.000   0.000
reduced       -0.341  -1.506   1.544 -12.758
  1    1.007  -0.433  -2.503   2.540  -9.811
  2    3.071  -0.581  -2.975   3.032 -11.048
  3    5.236  -0.716  -3.288   3.365 -12.291
  4    7.506  -0.855  -3.600   3.701 -13.365
  5    9.888  -0.999  -3.924   4.049 -14.288
and
Wind height on fire mesh        0.248m
layer altitude        U       V   speed  direction (degrees)
z0     0.020   0.000   0.000   0.000
fwh   0.248   -0.276  -1.609   1.632  -9.734
  1    1.007  -0.433  -2.503   2.540  -9.811
  2    3.071  -0.581  -2.975   3.032 -11.048
  3    5.236  -0.716  -3.288   3.365 -12.291
  4    7.506  -0.855  -3.600   3.701 -13.365
  5    9.888  -0.999  -3.924   4.049 -14.288
See also
Works with
- WRF-Fire Sun Jul 31 2011
- Matlab 2010a, 2011a

