How to visualize WRF-Fire output in Mayavi2
- Back to the WRF-SFIRE user guide.
Mayavi2 is a VTK based visualization application and API. This document is specifically about Mayavi2 developed by Enthought and not MavaVI, which is not in active development. The script developed for this purpose can conceivably create datasets that can be used with other visualization applications such as Paraview, Vistrails, etc. Future iterations of this script may provide this capability.
Installing
The easiest method of installing all needed software is to install the Enthought Python Distribution; however, this is a commercial product. Students and faculty can get a free academic license for this distribution [1]. As of version 7.0, the 64-bit version of EPD does not include mayavi, so users of Mac OS should download the 32-bit package.
Many software repositories for Linux also contain mayavi and its dependencies. Mac OS users can also install via macports. A more difficult option is to use easy_install to install all of the python packages; however, you will need to install all non-python libraries (VTK, wxWidgets, etc) manually. As a last resort, you can try installing from source.
Once you have installed, make sure everything is set up correctly by typing mayavi2 on the command line to start the application.
Importing Data from WRF output files
You can download a python script for importing data from WRF into a mayavi session here. This script will automatically take care of data conversion from netCDF including proper coordinate grids for all surface, fire, and atmospheric variables. The script can also combine several scalar field to create a vector field (such as for wind). As of version 4bb2e391a, the options for this script are as follows:
Usage: WRF2mayavi.py [options] filename

Options:
  -h, --help            show this help message and exit
  -v VARIABLES, --variables=VARIABLES
                        A comma separated list of variables
  -w VECTORS, --vectors=VECTORS
                        A comma separated list of vectors
                        (i.e. -w wind1:U:V:W,wind2:UF:VF)
  -t TIME, --time=TIME  The time slice to convert [default 0]
Try the -h flag for current usage.
A typical use of this script to visualize a number of variables from a fire simulation is as follows.
python WRF2mayavi.py -t 0 -v FGRNHFX,GRNHFX -w surface_wind:UF:VF,atm_wind:U:V:W wrfout
This will open a new mayavi application window that looks something like this.

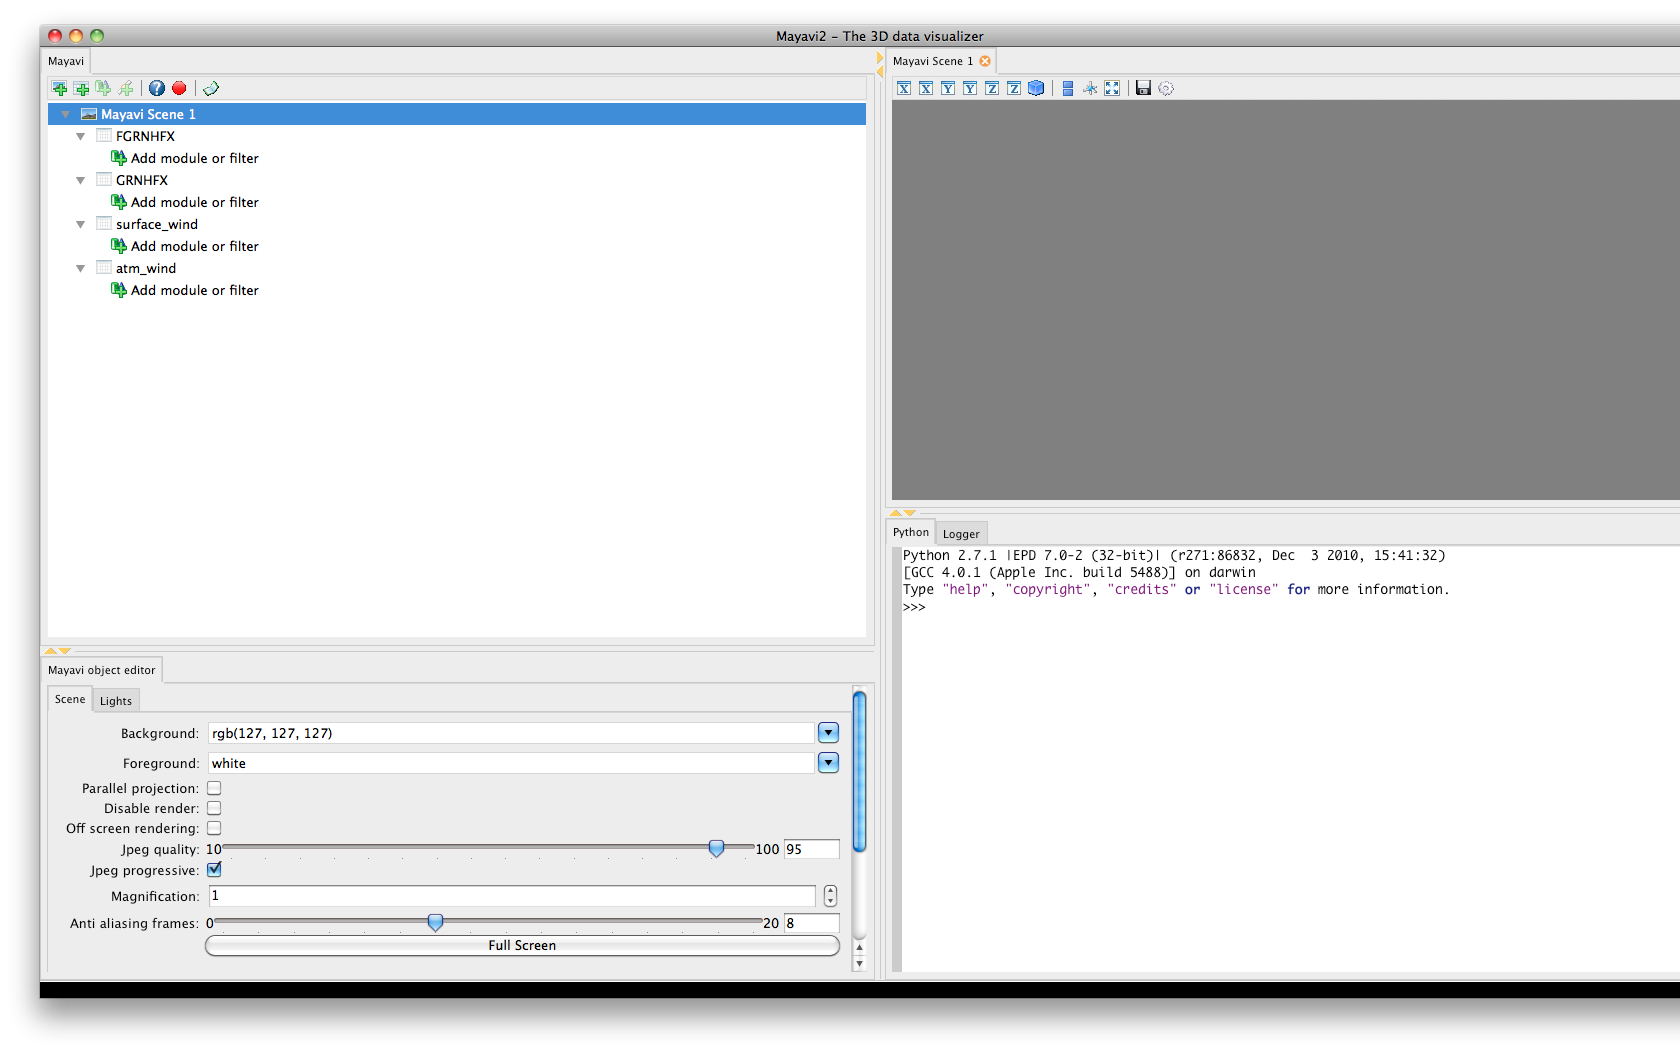
A list of all the variables and vectors you specified on the command line are given. Double click on the "Add module or filter" item under what you want to see. This will open a list of possible visualization modules that you can choose from. For surface variables, try "Surface". For vectors, try "Vectors" or "Streamline". For 3D scalar variables, try "ScalarCutPlane" or "IsoSurface". You can render multiple visualizations on a single figure window. See the mayavi documentation for details of how to use the GUI.
Tips and tricks
The number of options available for the visualizations is daunting. Here are a few tips to improve the visualizations of WRF-Fire output.
- To be continued...