Difference between revisions of "Jbeezley/hurricane"
Jump to navigation
Jump to search
| (4 intermediate revisions by the same user not shown) | |||
| Line 1: | Line 1: | ||
| − | + | Hurricane [http://www-math.ucdenver.edu/~jbeezley/data/u_v_t_q_slp_all_50mems_2009080600.tar.gz data] received from Fuqing Zhang. The tarball received contains 50 randomly perturbed ensemble members for an operational hurricane simulation in the Gulf of Mexico. Each NetCDF file contained in this tarball contains only the surface layer of variables U, V, SLP, T, and QVAPOR. Nine of the ensemble members given in the tarball are visualized in the gallary below along with some basic statistical analysis of the ensemble. | |
| + | |||
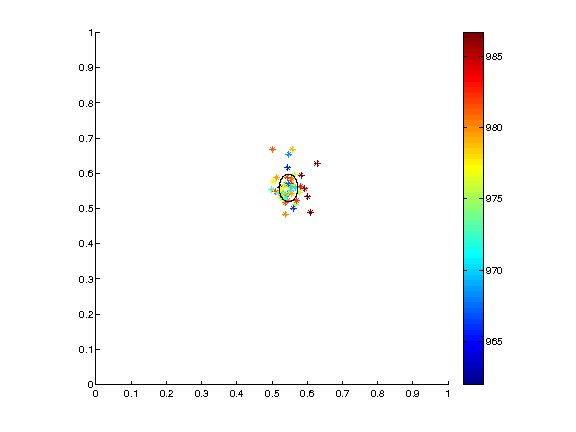
| + | [[File:Hurricane center.png|left|frame|The centers of each hurricane calculated as the location of minimum | ||
| + | surface pressure displayed as an asterisk. The color of the asterisks show the value of the minimum pressure. | ||
| + | The black oval shows the range of 1 standard deviation from the mean position.]] | ||
| + | |||
| + | <gallery perrow=4> | ||
| + | File:Hurricane SLP 001.png | ||
| + | File:Hurricane T 001.png | ||
| + | File:Hurricane QVAPOR 001.png | ||
| + | File:Hurricane wind 001.png | ||
| + | File:Hurricane SLP 002.png | ||
| + | File:Hurricane T 002.png | ||
| + | File:Hurricane QVAPOR 002.png | ||
| + | File:Hurricane wind 002.png | ||
| + | File:Hurricane SLP 003.png | ||
| + | File:Hurricane T 003.png | ||
| + | File:Hurricane QVAPOR 003.png | ||
| + | File:Hurricane wind 003.png | ||
| + | File:Hurricane SLP 004.png | ||
| + | File:Hurricane T 004.png | ||
| + | File:Hurricane QVAPOR 004.png | ||
| + | File:Hurricane wind 004.png | ||
| + | File:Hurricane SLP 005.png | ||
| + | File:Hurricane T 005.png | ||
| + | File:Hurricane QVAPOR 005.png | ||
| + | File:Hurricane wind 005.png | ||
| + | File:Hurricane SLP 006.png | ||
| + | File:Hurricane T 006.png | ||
| + | File:Hurricane QVAPOR 006.png | ||
| + | File:Hurricane wind 006.png | ||
| + | File:Hurricane SLP 007.png | ||
| + | File:Hurricane T 007.png | ||
| + | File:Hurricane QVAPOR 007.png | ||
| + | File:Hurricane wind 007.png | ||
| + | File:Hurricane SLP 008.png | ||
| + | File:Hurricane T 008.png | ||
| + | File:Hurricane QVAPOR 008.png | ||
| + | File:Hurricane wind 008.png | ||
| + | File:Hurricane SLP 009.png | ||
| + | File:Hurricane T 009.png | ||
| + | File:Hurricane QVAPOR 009.png | ||
| + | File:Hurricane wind 009.png | ||
| + | </gallery> | ||
| + | |||
| + | |||
| + | <gallery perrow=4 caption="The sample mean of each variable given in the ensemble."> | ||
| + | File:Hurricane mean p.png | ||
| + | File:Hurricane Mean t.png | ||
| + | File:Hurricane Mean q.png | ||
| + | File:Hurricane mean wind.png | ||
| + | </gallery> | ||
| + | |||
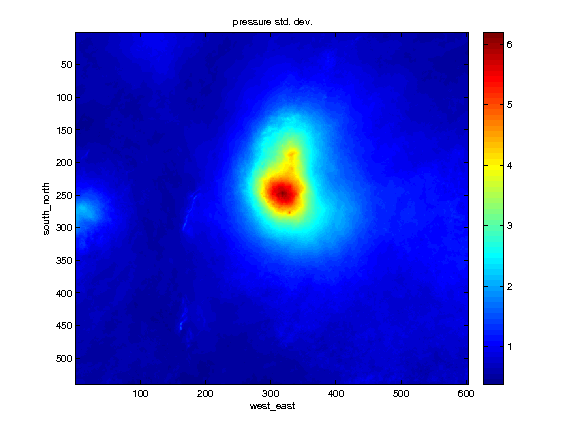
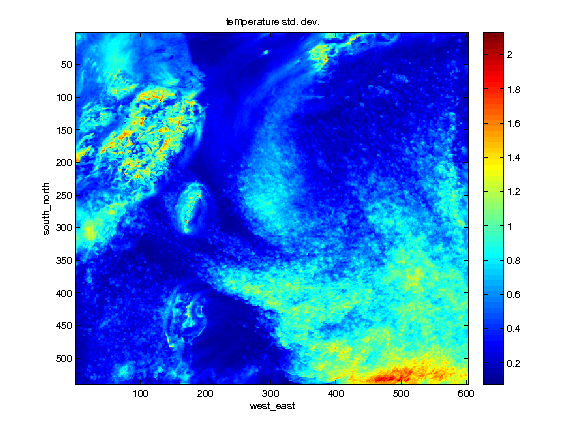
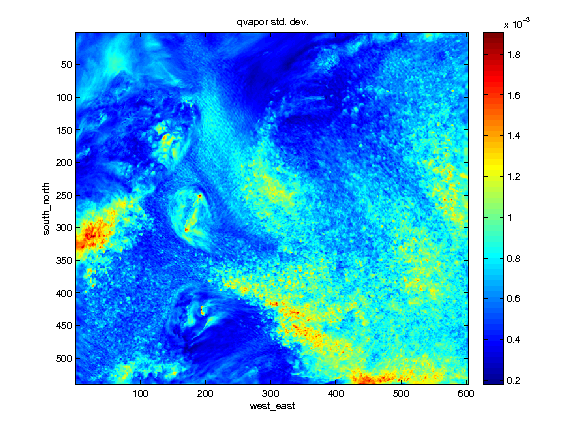
| + | <gallery perrow=4 caption="The sample standard deviation of each variable given in the ensemble."> | ||
| + | File:Hurricane P stdev.png | ||
| + | File:Hurricane T stdev.png | ||
| + | File:Hurricane Q stdev.png | ||
| + | </gallery> | ||
Latest revision as of 08:30, 31 October 2011
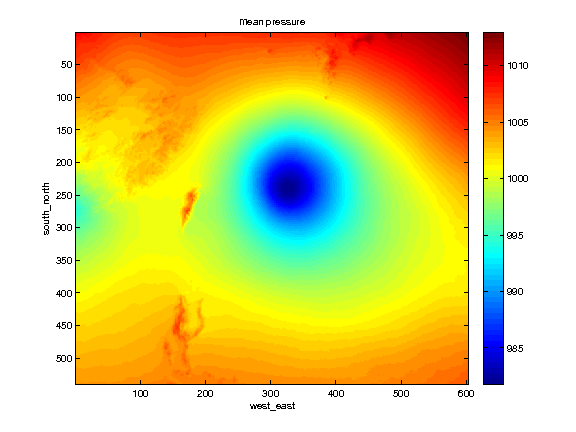
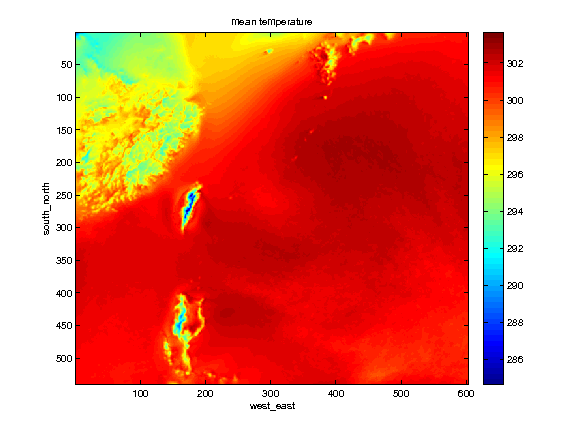
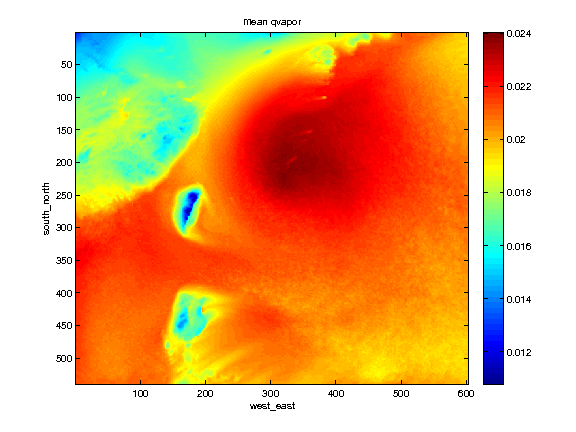
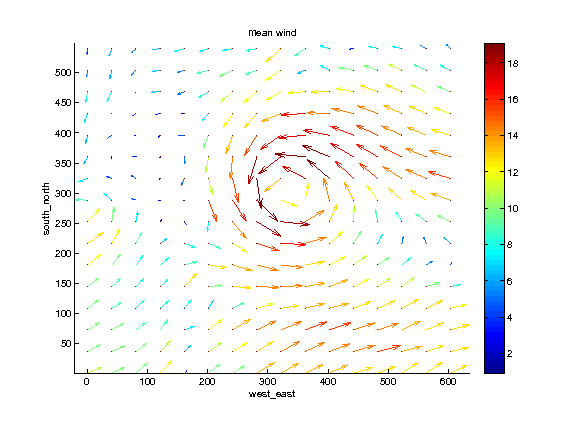
Hurricane data received from Fuqing Zhang. The tarball received contains 50 randomly perturbed ensemble members for an operational hurricane simulation in the Gulf of Mexico. Each NetCDF file contained in this tarball contains only the surface layer of variables U, V, SLP, T, and QVAPOR. Nine of the ensemble members given in the tarball are visualized in the gallary below along with some basic statistical analysis of the ensemble.

The centers of each hurricane calculated as the location of minimum surface pressure displayed as an asterisk. The color of the asterisks show the value of the minimum pressure. The black oval shows the range of 1 standard deviation from the mean position.


- The sample mean of each variable given in the ensemble.


- The sample standard deviation of each variable given in the ensemble.